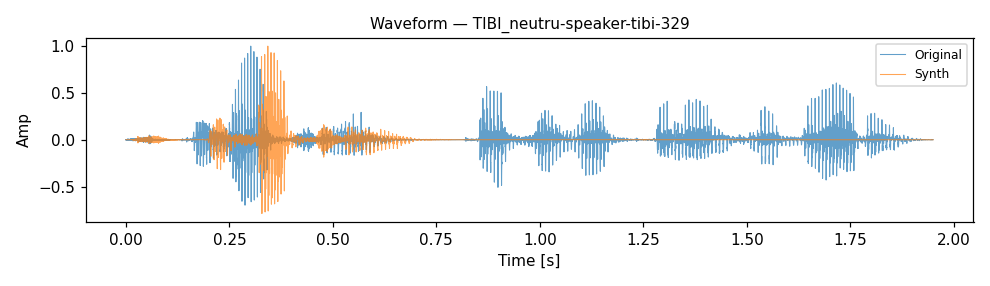
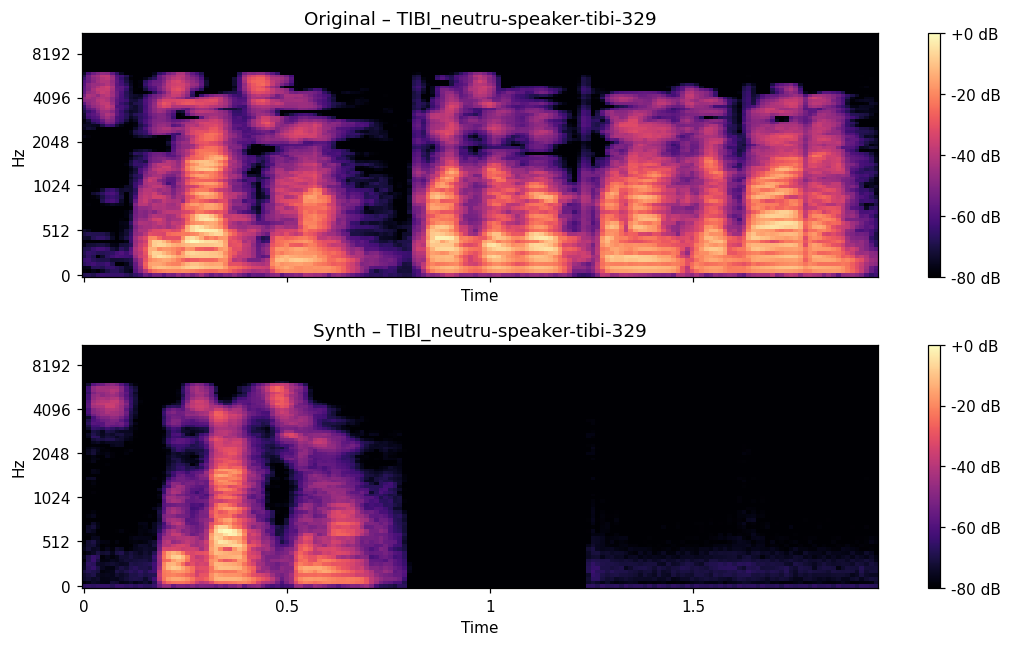
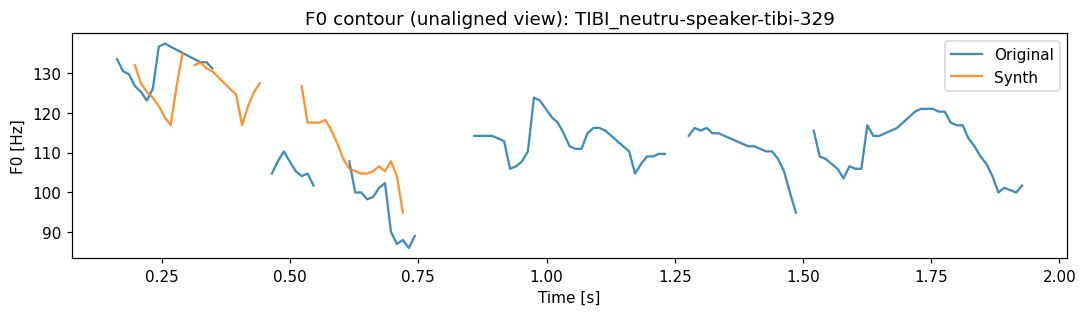
How to read these:
MCD (lower=better, ~4–8 dB typical) and
F0 RMSE / F0 corr are DTW-aligned and are the
reliable metrics for TTS. STOI and PESQ need
sample-level time alignment, which synthesized speech does not have, so they sit
near their floor — treat them as secondary / informational only.
SWARA Multispeaker — Reconstruction
Base multi-speaker VITS: synthesized speech vs the original recording for 8 speakers.
Summary
| group | file | MCD_DTW dB | F0_RMSE Hz | F0_CORR | VUV_ERR | STOI | PESQ_WB | SI_SDR dB |
|---|---|---|---|---|---|---|---|---|
| dcs | dcs_rnd3_428 | 6.944 | 43.74 | 0.225 | 0.087 | 0.298 | 1.048 | -37.34 |
| ddm | ddm_rnd1_416 | 7.537 | 20.63 | 0.625 | 0.075 | 0.082 | 1.056 | -29.44 |
| gnm | gnm_rnd3_228 | 8.651 | 39.40 | 0.411 | 0.154 | 0.107 | 1.060 | -30.40 |
| htm | htm_rnd2_189 | 10.264 | 17.35 | 0.524 | 0.189 | 0.152 | 1.062 | -28.23 |
| ptl | ptl_rnd1_352 | 8.515 | 24.73 | -0.340 | 0.306 | 0.150 | 1.034 | -41.24 |
| sds | sds_rnd1_263 | 5.332 | 10.53 | -0.054 | 0.188 | 0.260 | 1.094 | -51.12 |
| smm | smm_rnd2_406 | 6.595 | 34.62 | 0.402 | 0.067 | 0.138 | 1.061 | -63.30 |
| tss | tss_rnd1_381 | 7.428 | 15.84 | 0.150 | 0.176 | 0.184 | 1.031 | -29.56 |
| MEAN | 7.658 | 25.86 | 0.243 | 0.155 | 0.171 | 1.056 | -38.83 |
Per-item details
dcs
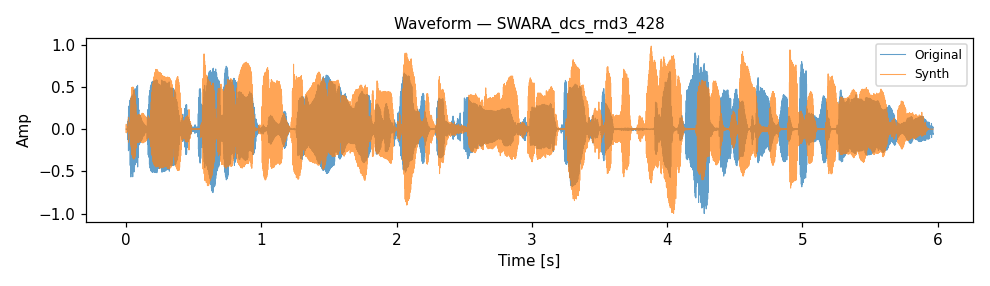
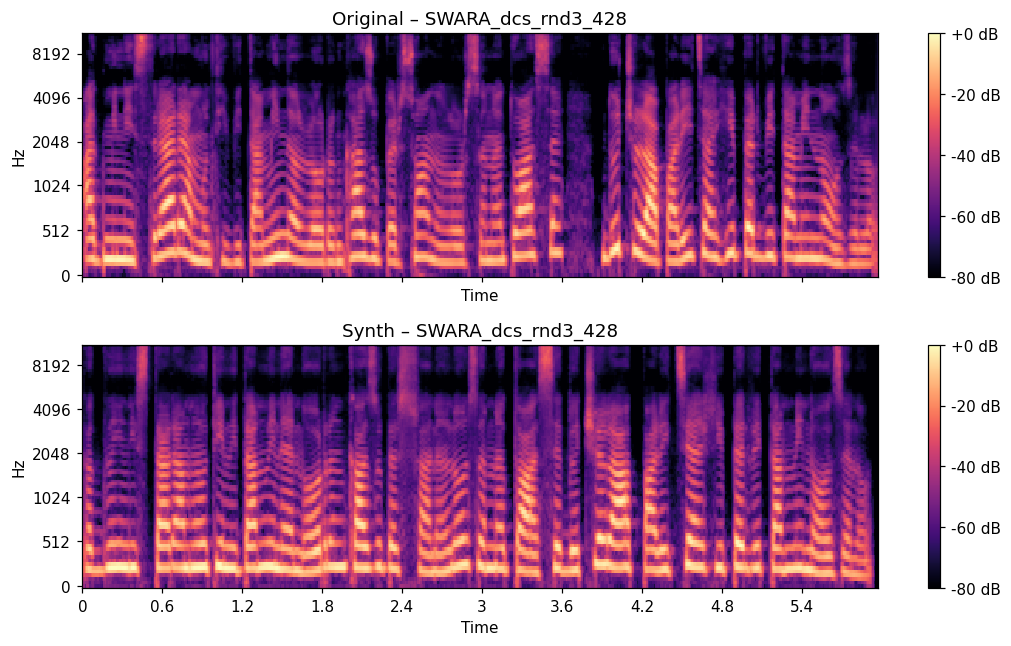
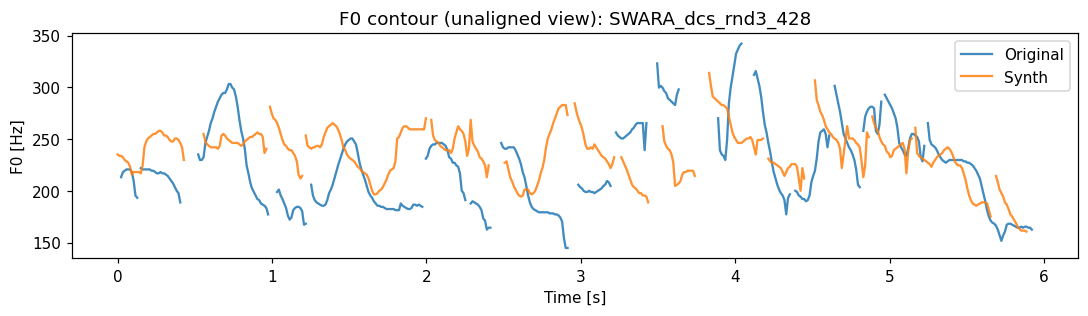
dcs_rnd3_428MCD6.944dB
F0 RMSE43.74Hz
F0 corr0.225
STOI0.298
PESQ1.048
Original
Synthesized
ddm
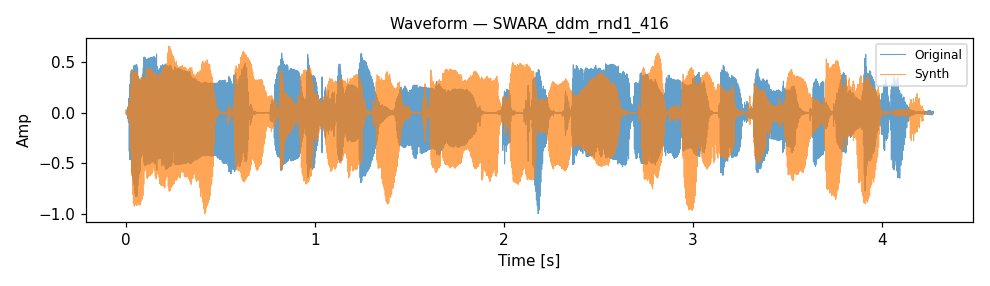
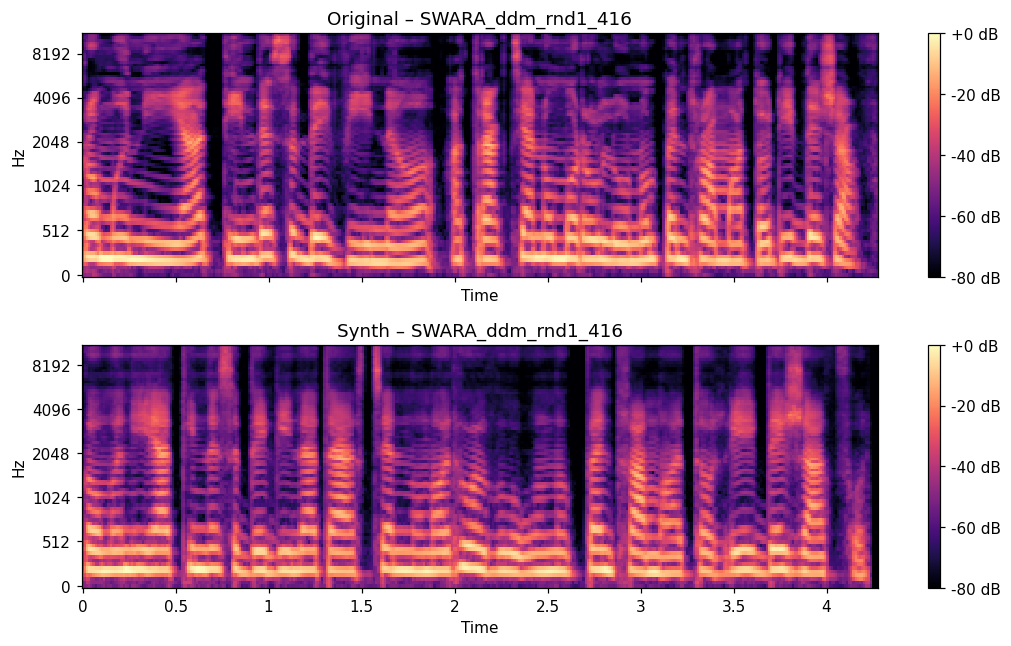
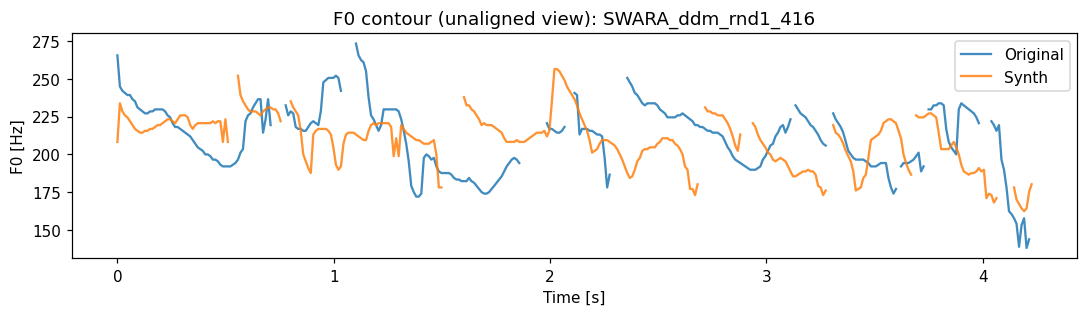
ddm_rnd1_416MCD7.537dB
F0 RMSE20.63Hz
F0 corr0.625
STOI0.082
PESQ1.056
Original
Synthesized
gnm
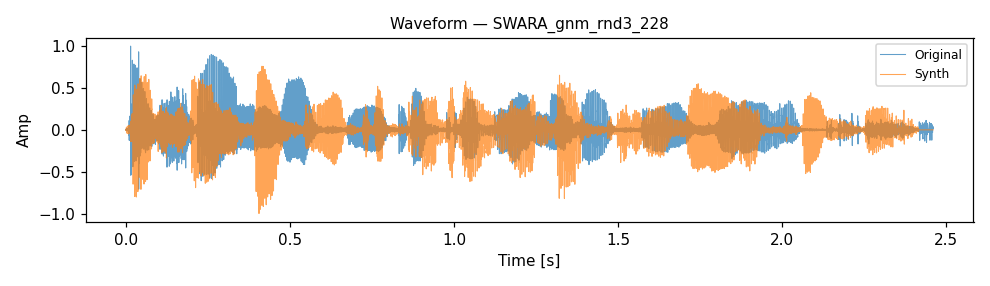
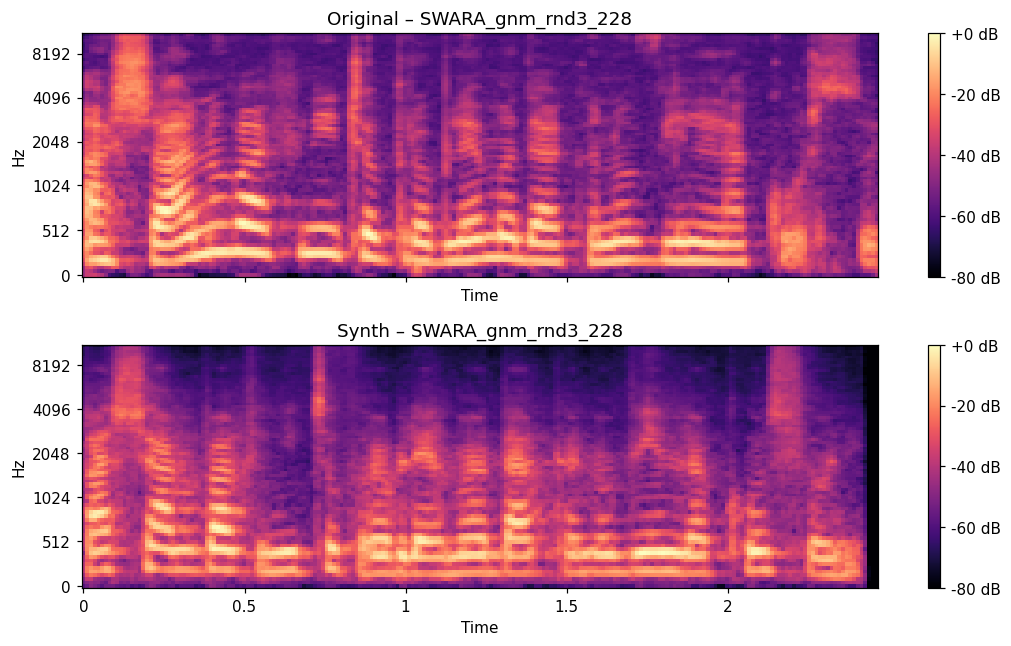
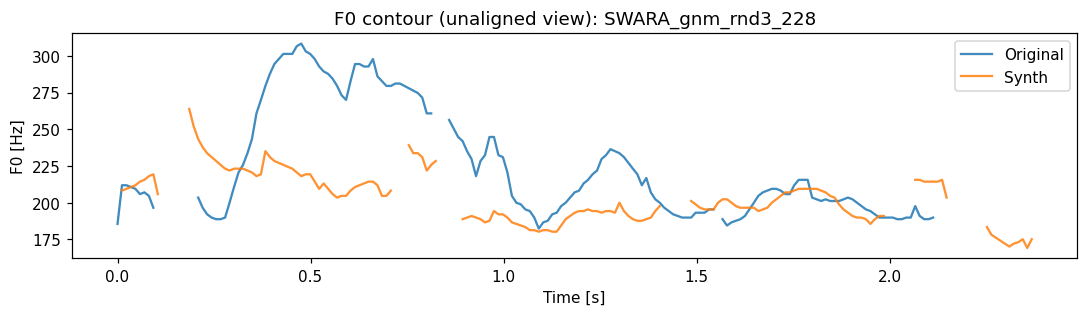
gnm_rnd3_228MCD8.651dB
F0 RMSE39.40Hz
F0 corr0.411
STOI0.107
PESQ1.060
Original
Synthesized
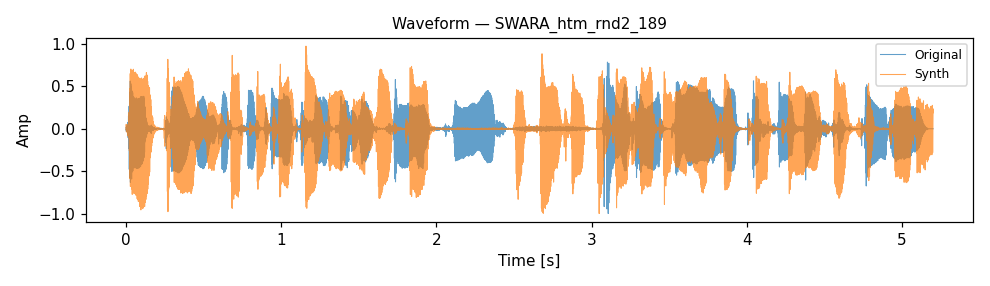
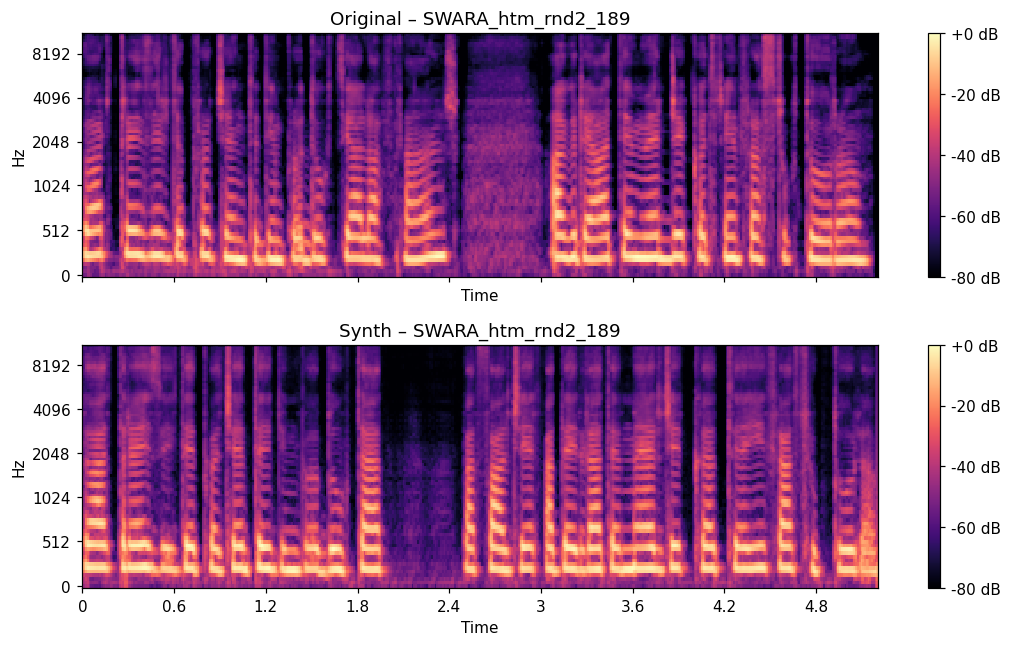
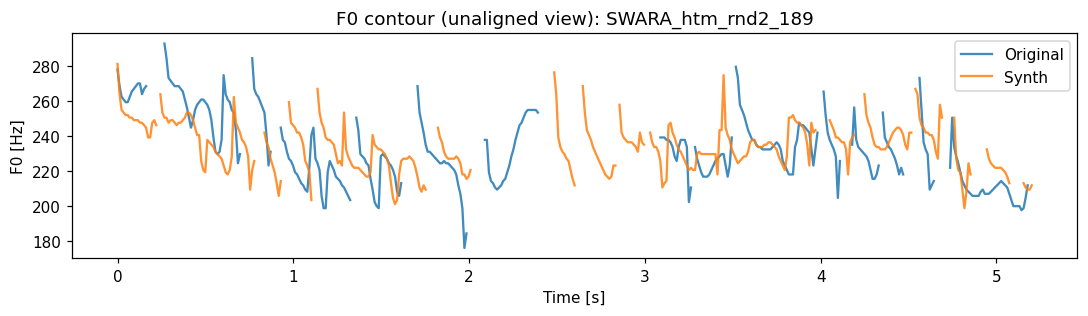
htm
htm_rnd2_189MCD10.264dB
F0 RMSE17.35Hz
F0 corr0.524
STOI0.152
PESQ1.062
Original
Synthesized
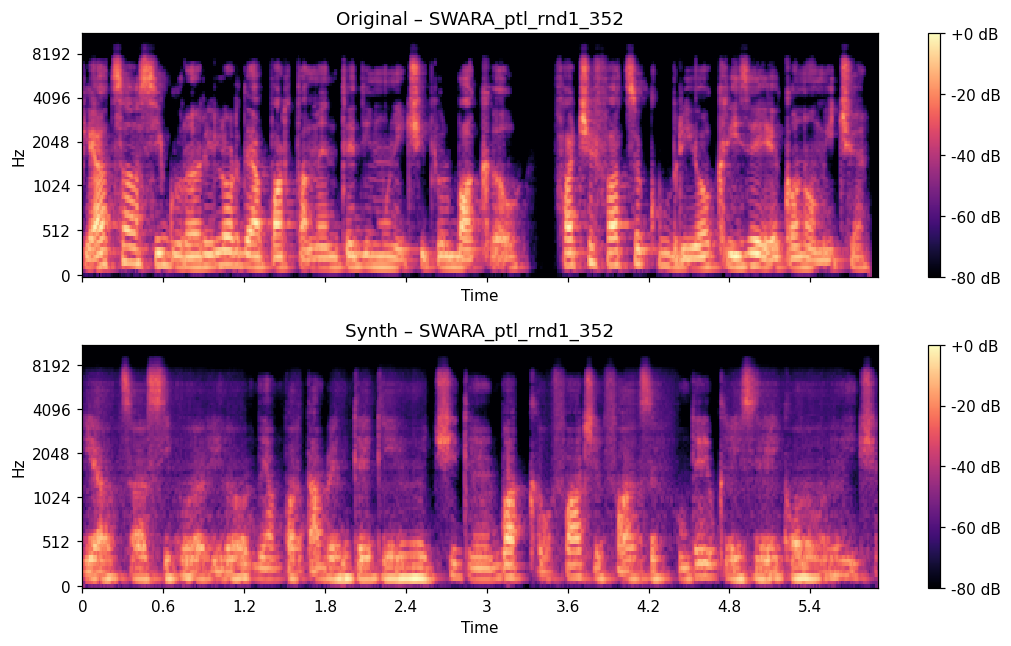
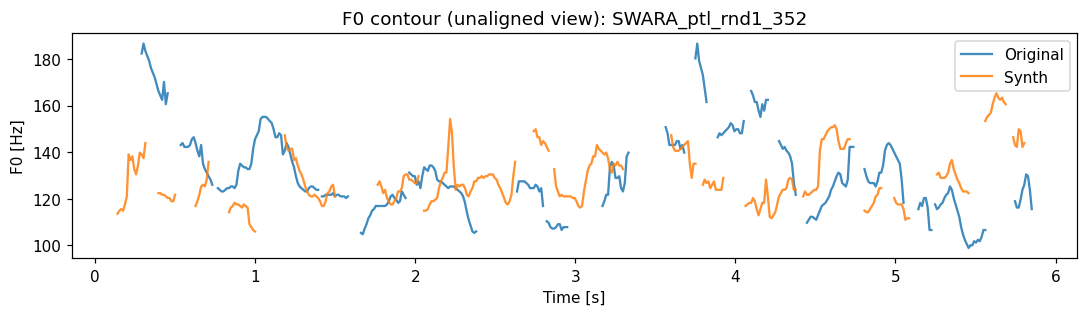
ptl
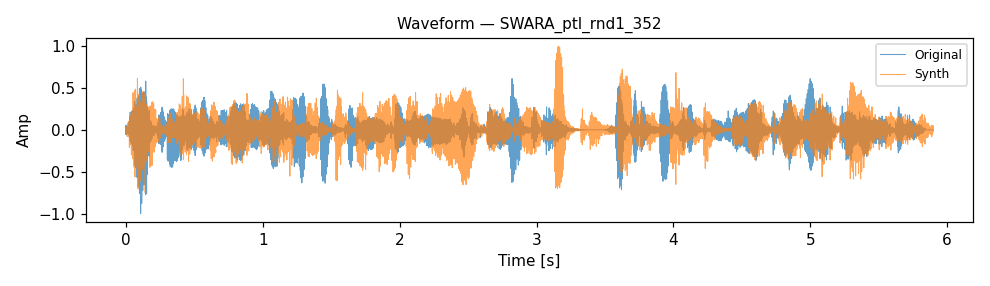
ptl_rnd1_352MCD8.515dB
F0 RMSE24.73Hz
F0 corr-0.340
STOI0.150
PESQ1.034
Original
Synthesized
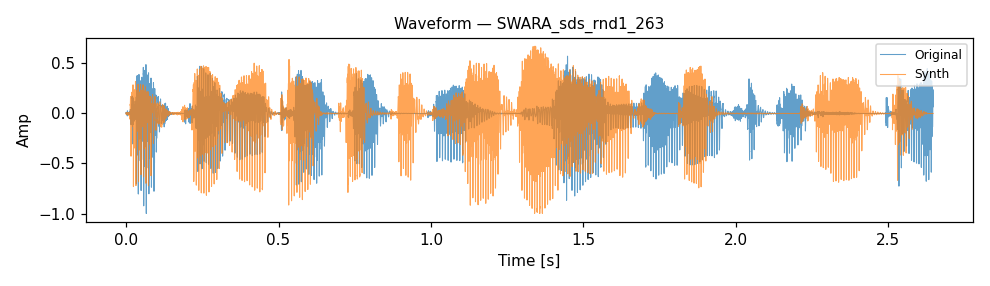
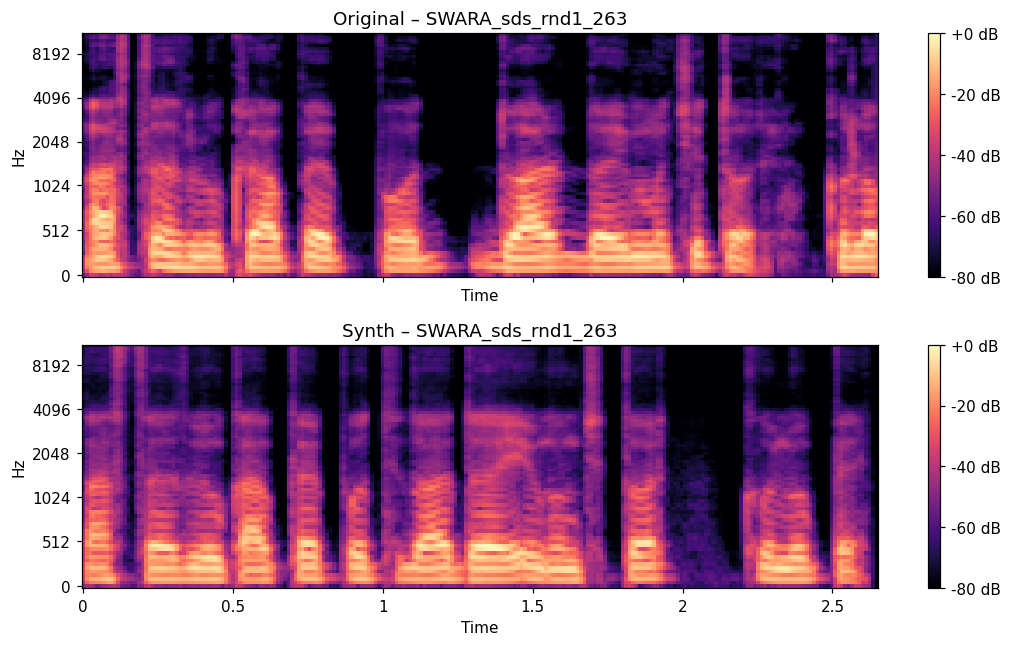
sds
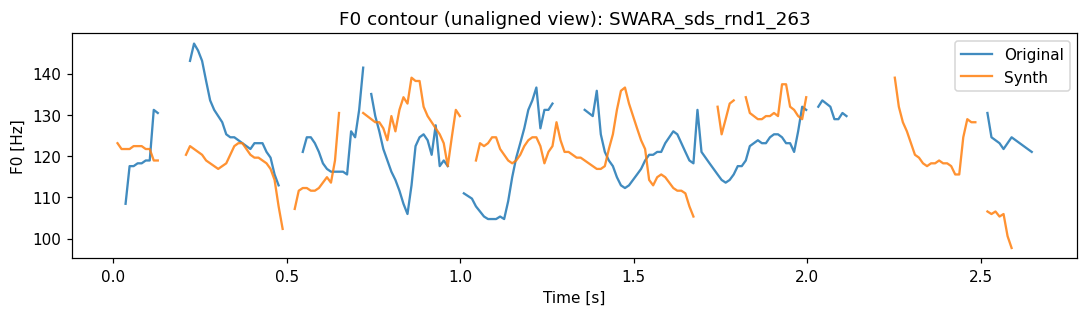
sds_rnd1_263MCD5.332dB
F0 RMSE10.53Hz
F0 corr-0.054
STOI0.260
PESQ1.094
Original
Synthesized
smm
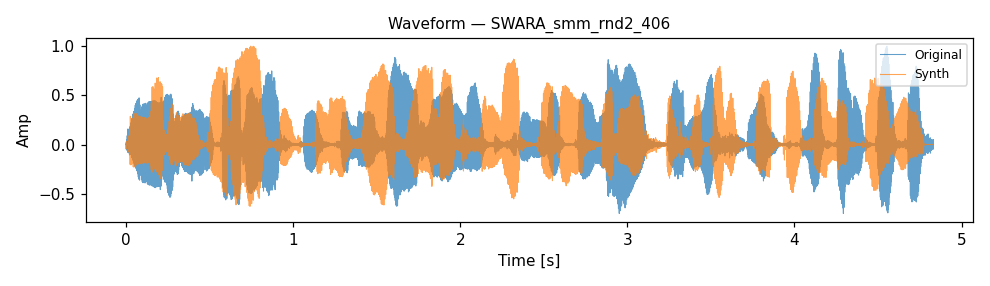
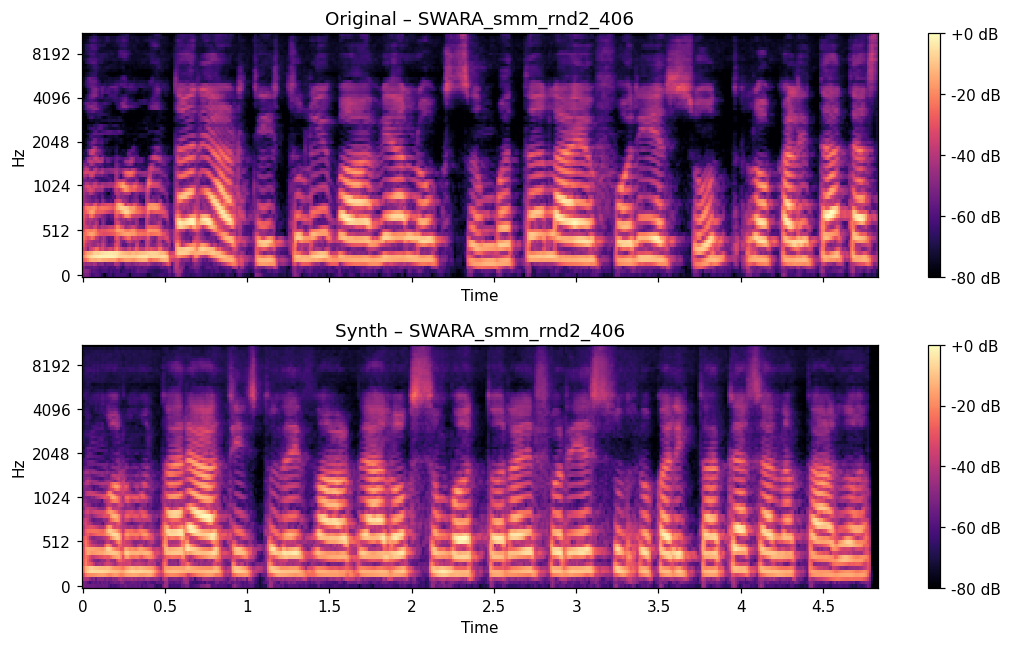
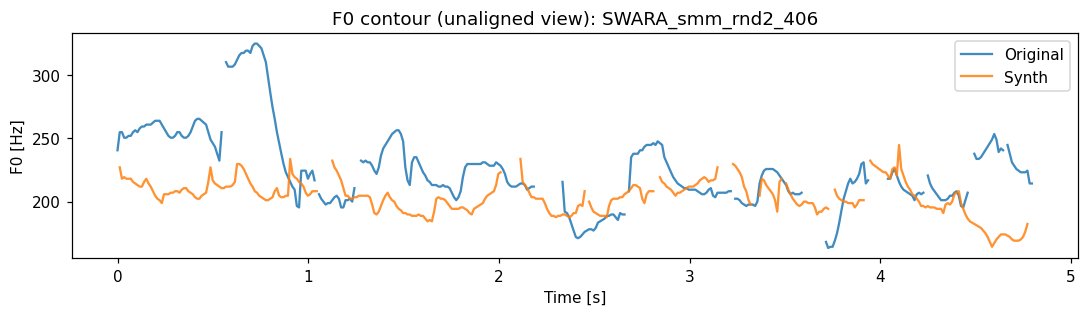
smm_rnd2_406MCD6.595dB
F0 RMSE34.62Hz
F0 corr0.402
STOI0.138
PESQ1.061
Original
Synthesized
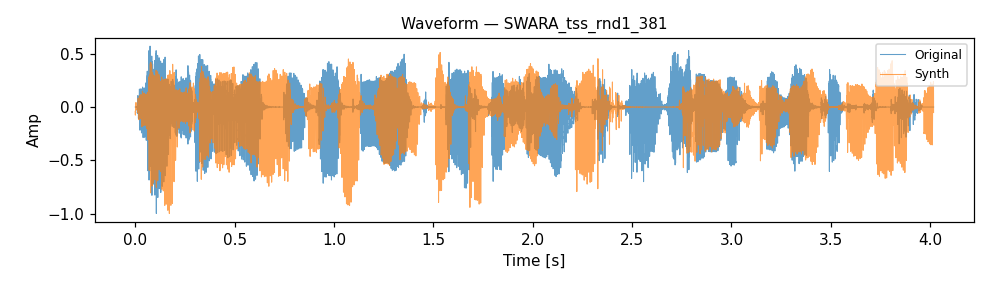
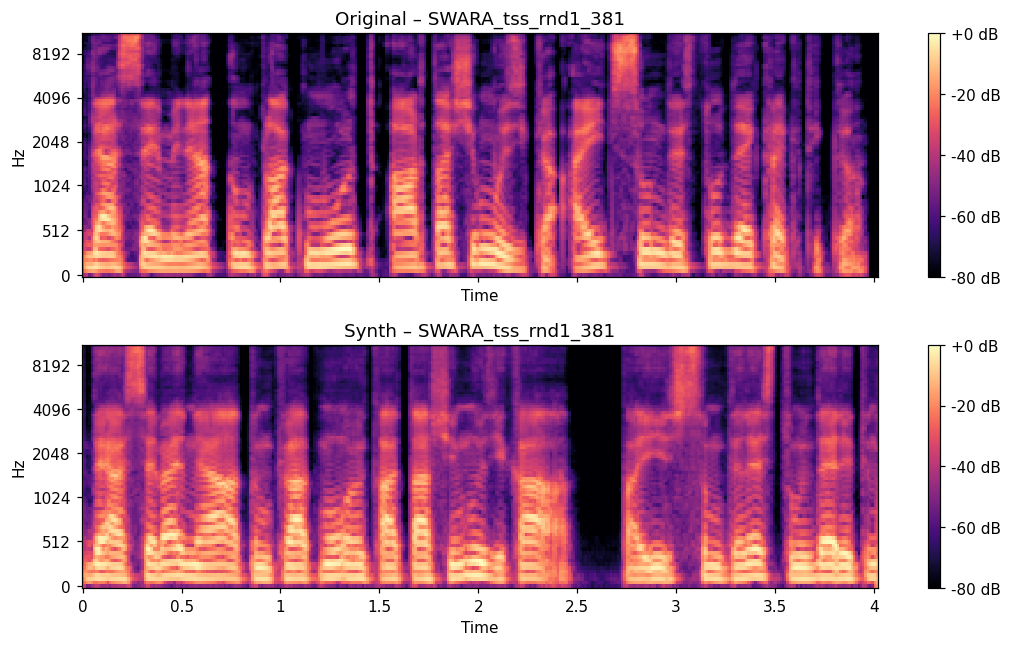
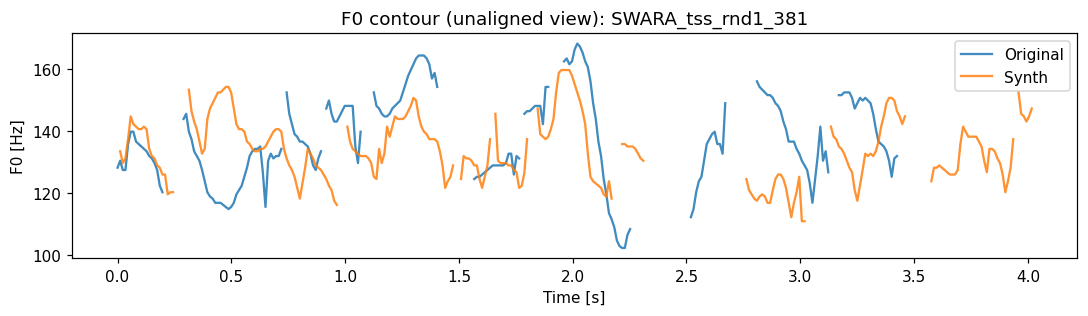
tss
tss_rnd1_381MCD7.428dB
F0 RMSE15.84Hz
F0 corr0.150
STOI0.184
PESQ1.031
Original
Synthesized
Emotion Fine-tune — CATA (Catalina)
Single-speaker emotional model (emotion-as-speaker): synthesized vs original per emotion.
Summary
| group | file | MCD_DTW dB | F0_RMSE Hz | F0_CORR | VUV_ERR | STOI | PESQ_WB | SI_SDR dB |
|---|---|---|---|---|---|---|---|---|
| fericit | fericit-speaker-catalina-335 | 5.879 | 32.83 | 0.816 | 0.183 | 0.239 | 1.106 | -32.68 |
| furios | furios-speaker-catalina-1 | 8.688 | 30.48 | 0.763 | 0.188 | 0.141 | 1.041 | -61.77 |
| neutru | neutru-speaker-catalina-338 | 6.816 | 42.08 | 0.701 | 0.352 | 0.048 | 1.044 | -38.90 |
| MEAN | 7.128 | 35.13 | 0.760 | 0.241 | 0.143 | 1.064 | -44.45 |
Per-item details
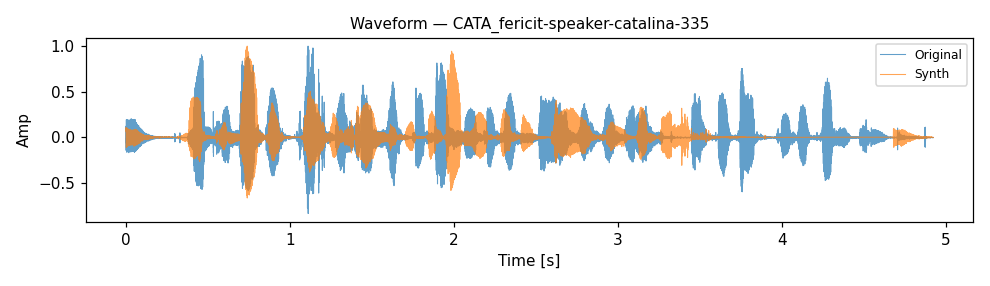
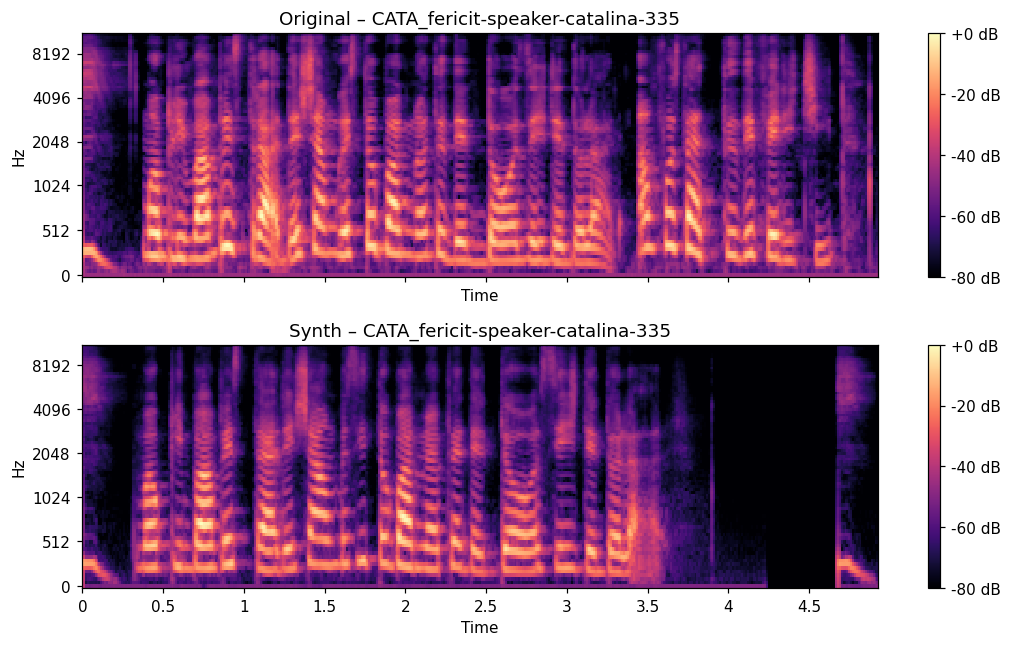
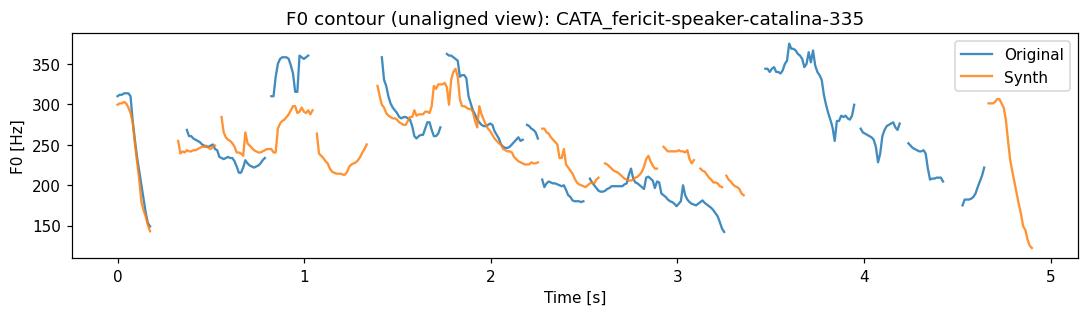
fericit
fericit-speaker-catalina-335MCD5.879dB
F0 RMSE32.83Hz
F0 corr0.816
STOI0.239
PESQ1.106
Original
Synthesized
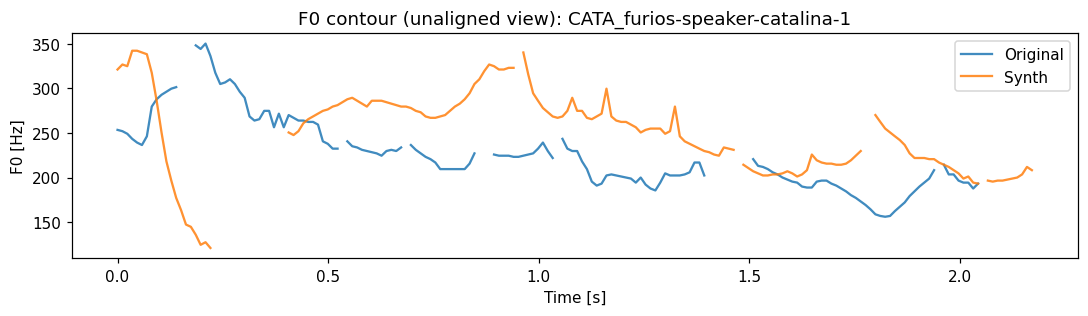
furios
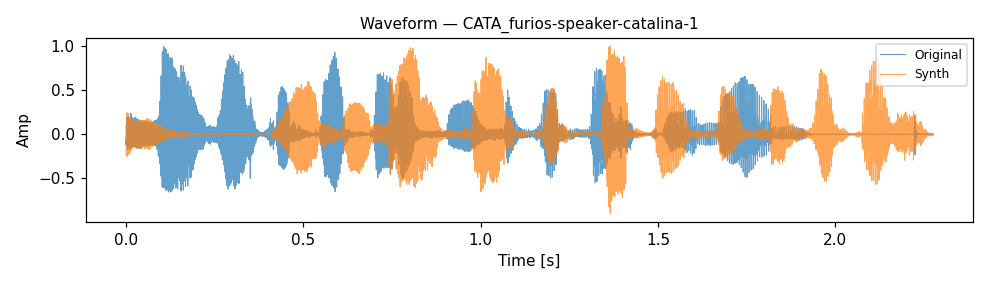
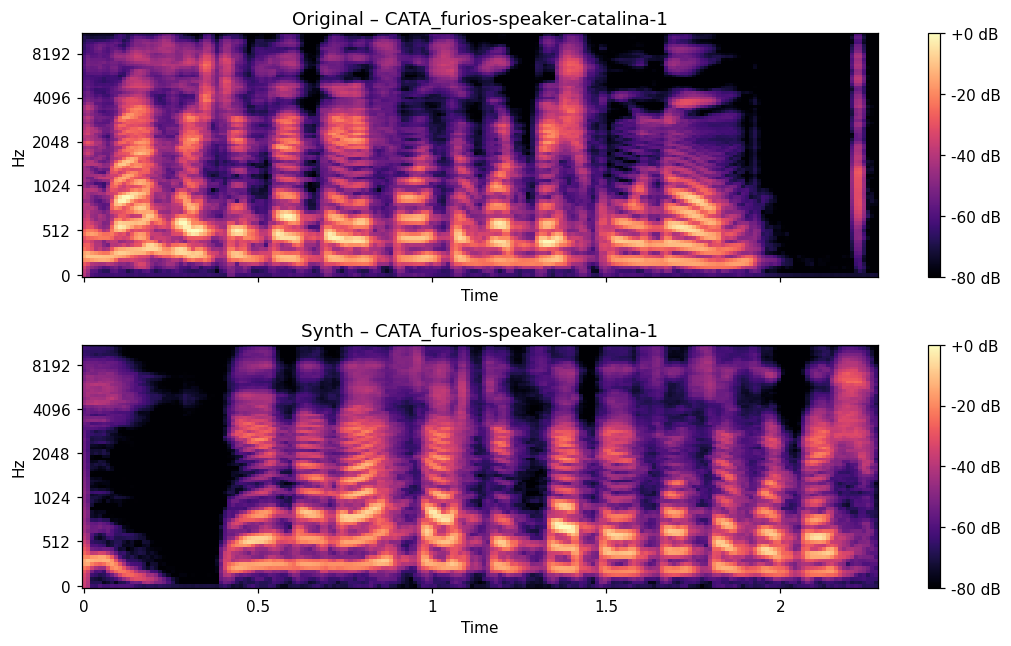
furios-speaker-catalina-1MCD8.688dB
F0 RMSE30.48Hz
F0 corr0.763
STOI0.141
PESQ1.041
Original
Synthesized
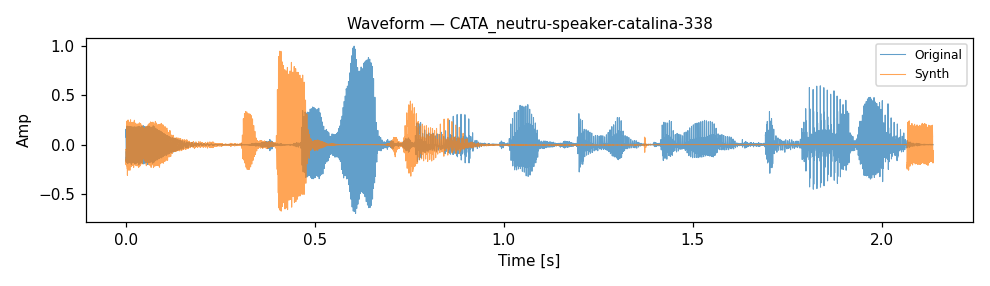
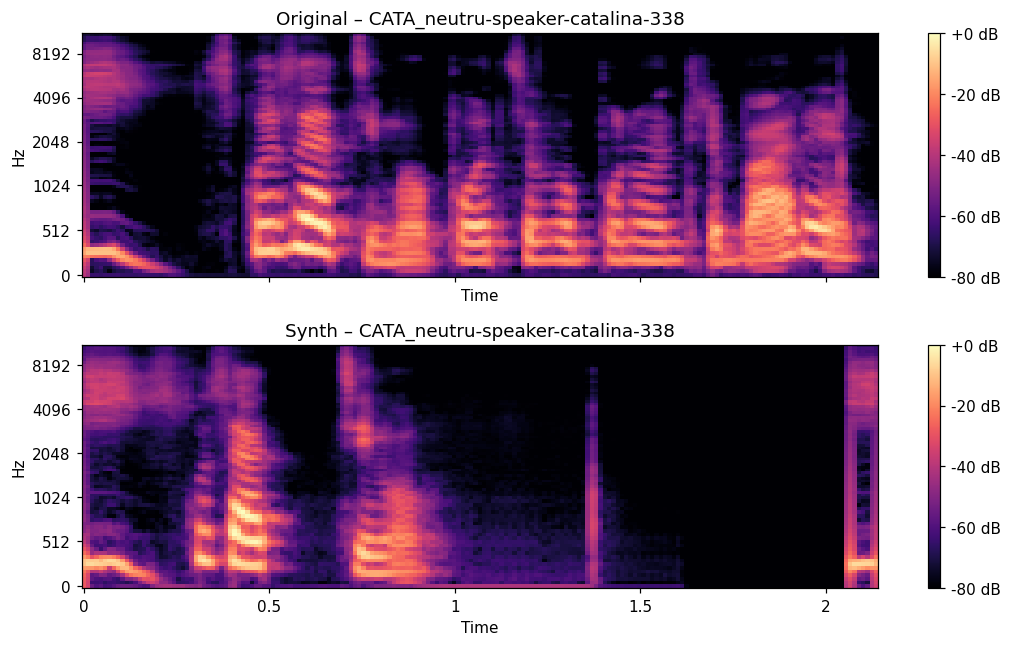
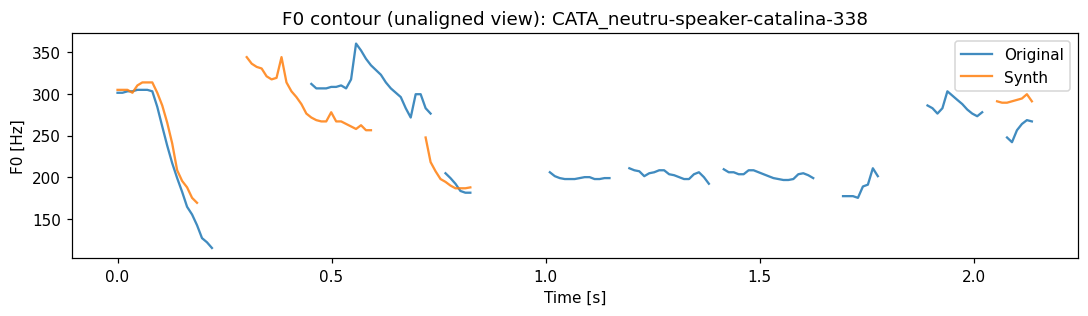
neutru
neutru-speaker-catalina-338MCD6.816dB
F0 RMSE42.08Hz
F0 corr0.701
STOI0.048
PESQ1.044
Original
Synthesized
Emotion Fine-tune — TIBI
Single-speaker emotional model (emotion-as-speaker): synthesized vs original per emotion.
Summary
| group | file | MCD_DTW dB | F0_RMSE Hz | F0_CORR | VUV_ERR | STOI | PESQ_WB | SI_SDR dB |
|---|---|---|---|---|---|---|---|---|
| fericit | fericit-speaker-tibi-327 | 3.784 | 18.33 | 0.163 | 0.091 | 0.198 | 2.564 | -33.87 |
| furios | furios-speaker-tibi-1 | 4.453 | 6.34 | 0.732 | 0.107 | 0.213 | 1.615 | -43.34 |
| neutru | neutru-speaker-tibi-329 | 3.325 | 7.32 | 0.648 | 0.060 | 0.157 | 3.281 | -32.66 |
| MEAN | 3.854 | 10.66 | 0.514 | 0.086 | 0.189 | 2.487 | -36.62 |
Per-item details
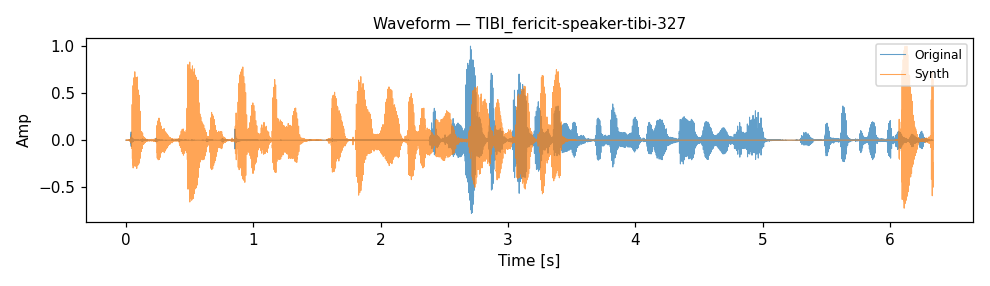
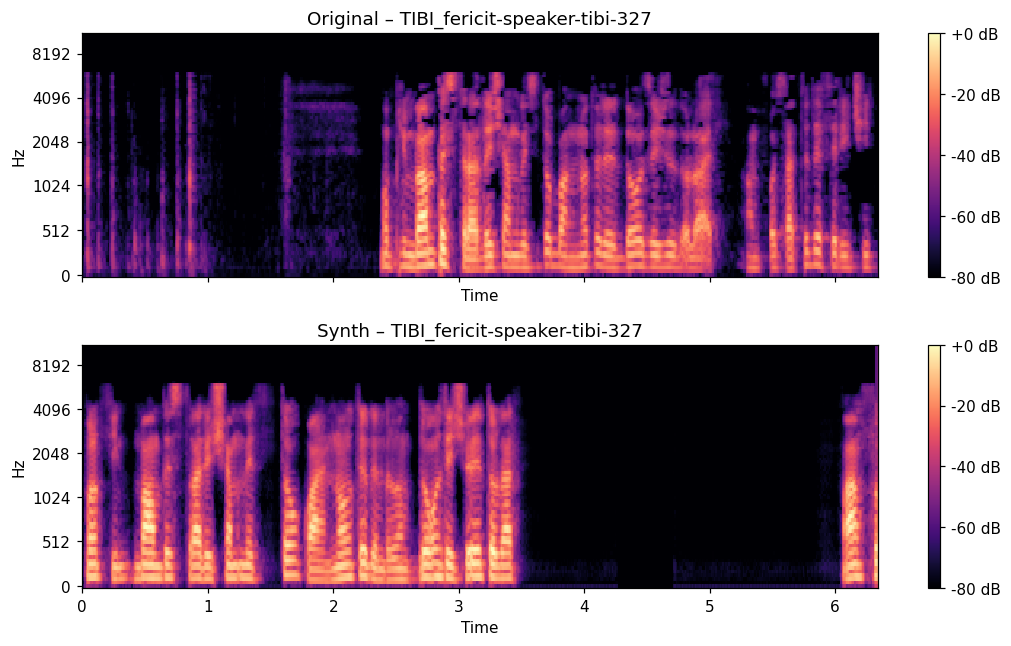
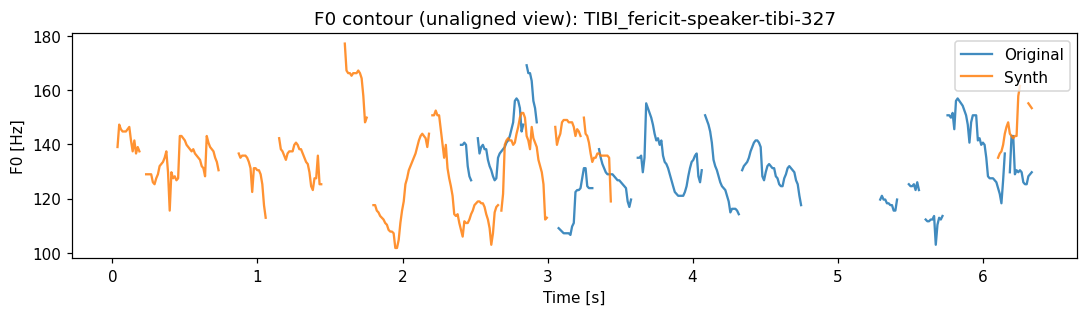
fericit
fericit-speaker-tibi-327MCD3.784dB
F0 RMSE18.33Hz
F0 corr0.163
STOI0.198
PESQ2.564
Original
Synthesized
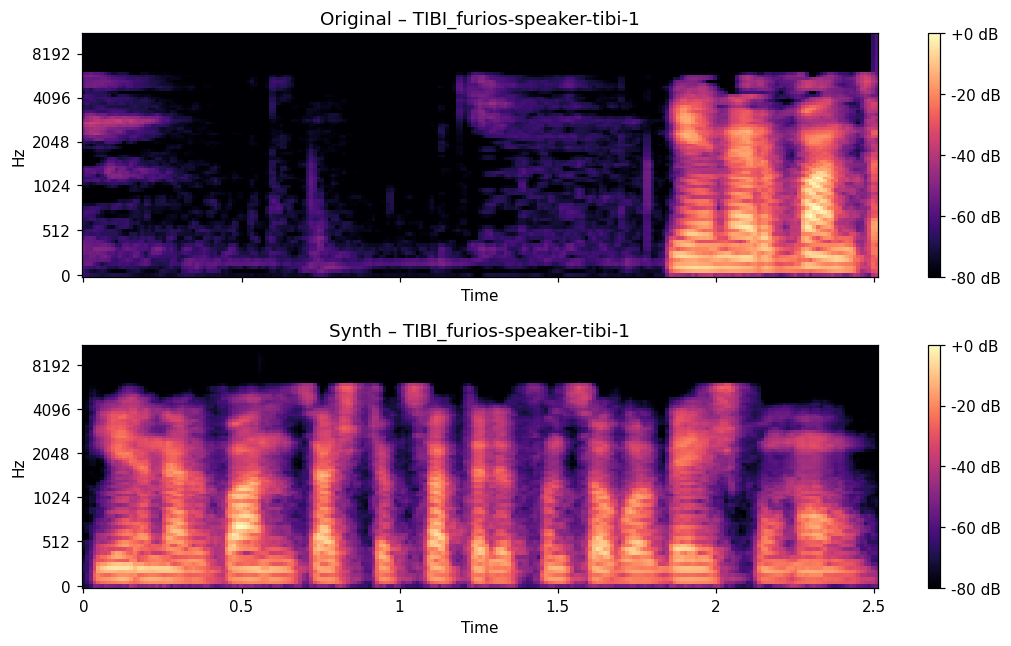
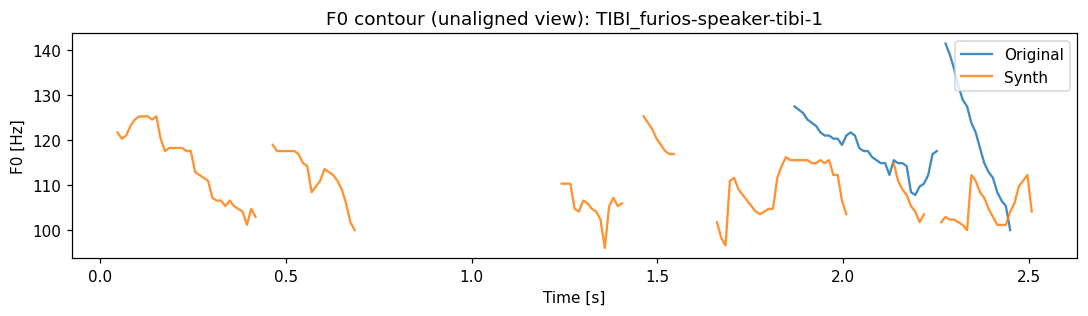
furios
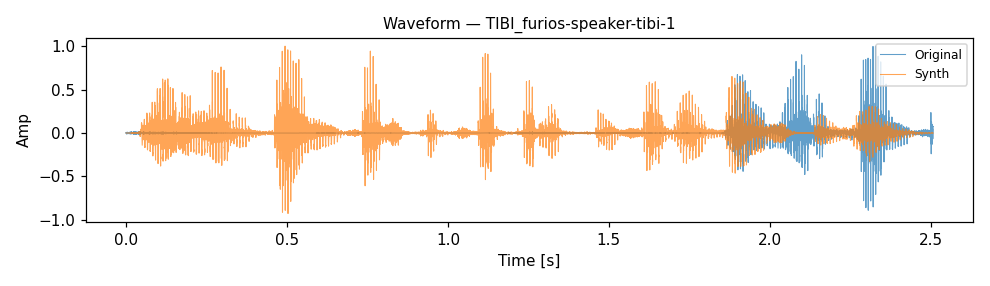
furios-speaker-tibi-1MCD4.453dB
F0 RMSE6.34Hz
F0 corr0.732
STOI0.213
PESQ1.615
Original
Synthesized
neutru
neutru-speaker-tibi-329MCD3.325dB
F0 RMSE7.32Hz
F0 corr0.648
STOI0.157
PESQ3.281
Original
Synthesized